
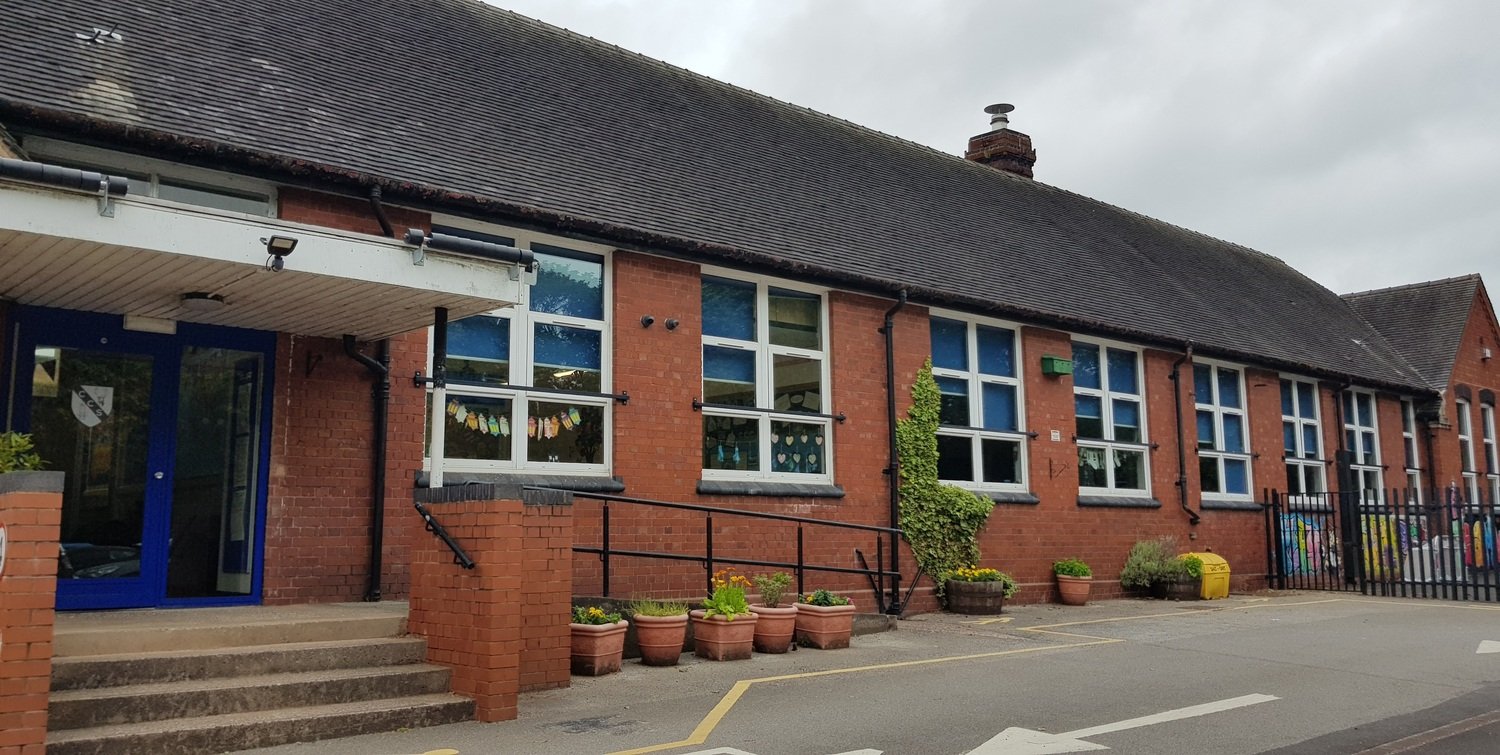


Exam and Assessment Results
Please note that the government will not be publishing KS2 school level data for 2020 to 2022.
It has also not be possible to calculate key stage 1 to key stage 2 progress measures for 2023 to 2024 or 2024 to 2025 academic years. This is because there is no key stage 1 baseline available to calculate primary progress measures for these years, because of Covid disruption.
School Dfe performance tables
Follow this link to our page on the Dfe website, which contains our Key Stage 2 performance tables as well as other statistics about our school.
Performance tables service
This link to the school and college performance tables service, allows for the comparison of school performance results.
KS2 results and progress
The government will not be publishing Key stage 2 (primary) school level data for 2020 to 2022. They are also unable to publish progress scores for the 2023/24 and 2024/25 academic years.
Our results can also be found here
| Reading | Writing | Maths | |
| Progress Score 2023 |
-7.3 -10.3 to -4.3 |
-5.5 -8.3 to -2.7 |
-10.9 -13.8 to -8.0 |
| Progress scores 2019 |
-9.1 -11.8 to -6.3 |
-14.8 -17.3 to -12.3 |
-9.9 -12.3 to -7.6 |
| Progress scores 2018 |
-11 -13.7 to -8.3 |
-14.2 -16.5 to -11.9 |
-10.7 -13 to -8.4 |
| Average 'scaled scores' | Reading | Maths |
| 2023 | 96 | 87 |
| 2019 | 90 | 90 |
| 2018 | 89 | 88 |
| Percentage of pupils who achieved the expected standard in reading, writing and maths: | |
| 2023 | 0% |
| 2019 | 0% |
| 2018 | 0% |
| Percentage of pupils achieving a higher standard in reading, writing and maths | |
| 2023 | 0% |
| 2019 | 0% |
| 2018 | 0% |